


| Tagged By | Tagging Vessel | Reported By | Reporting Vessel | Days at Liberty |
| Don Gates | Killin Time II | Matthew Sherman | No Name | 12 |
| Chase Benedict | Explorer Scout | Michael Mintz | Chicama | 5 |
| Bryan Gilmore | Wahoo | Mark Didario | Bomchelle | 4 |
| Allen Lewis | Killin Time II | Dennis Schreider | All Star II | 3 |
| Bryan Gilmore | Wahoo | Sebastian Fraguela | No Name | 2 |
| Rich Benton | Killin Time II | Eddy Gonzalez | Fish Scale | 2 |
| Don Gates | Killin Time II | Mark Melhado | No Name | 2 |
| Charles Wamer | Wam-Jam | Christopher Self | Lega Sea | 2 |
| Tim Heiser | Irish Wake | Samuel Greggs | Fish Nip | 0 |
| Don Gates | Killin Time II | Don Gates | Killin Time II | 0 |
| Angie Gonder | Killin Time II | Luke Dennis | No Name | 0 |
Over the past month, 451 reported tag deployments were logged from 16 participating vessels. Of those releases, 28% were larger than 20″ (legal limit off eastern FL, GA, and SC), which shows the dedication of many anglers to dolphinfish conservation through this tagging program. In June 2019, a total of 38 vessels tagged and released 608 fish with 19% larger than the South Atlantic Bight minimum size. While tag deployments are not as high as last June, the recent uptick in tagging activity still led to several recorded movements, and to date the program has received 8 recoveries. Seven were generated by Captain Don Gates and the Killin’ Time II fishing team and one by Captain’s Jimbo and Rick Thomas aboard the Thomas Flyer. Along the eastern Florida shelf this month, the average movement rate for dolphin was 24.69 miles per day (mpd), very similar to last year’s 21.69 mpd. Together, these movements rates are between 55% to 60% slower than 2018’s average (55.46 mpd) and are also among the slowest eastern Florida movement rates observed in this 19 year study.


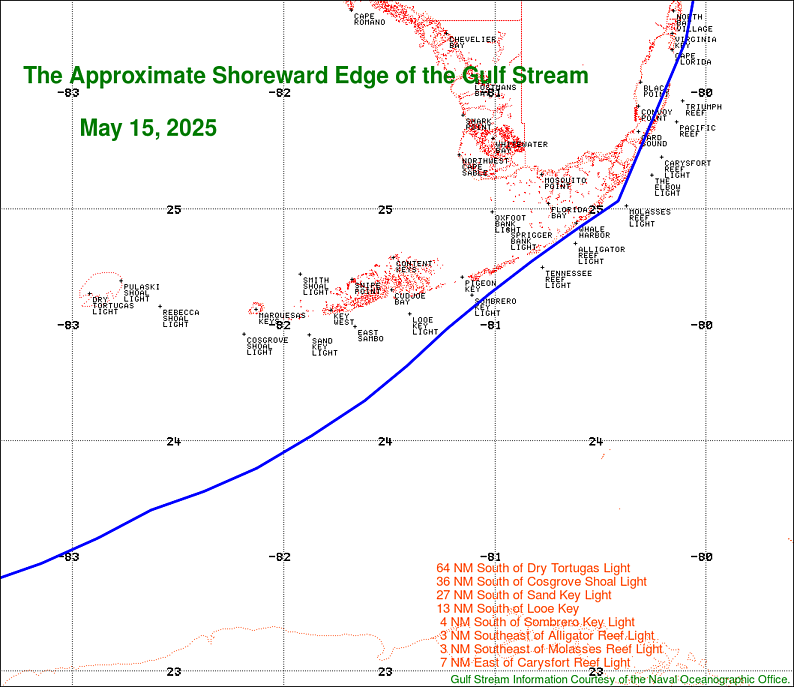
Why are there slower movement rates? There is no question that dolphin are influenced by oceanography but correctly modeling how closely dolphin do or do not orient with major ocean currents is a difficult task. The Straits of Florida, however, afford a unique geographic region where one of the world’s most powerful western boundary currents, the Gulf Stream, flows northward along the eastern Florida shelf and ultimately toward the north Atlantic. The Straits of Florida is also the region where 68.9% (n = 16,030) of all dolphinfish tag deployments have occurred for the Dolphinfish Research Program (DRP) through the end of 2017. Of those deployments, 236 fish were recovered off eastern Florida, with days at liberty < 60 days within the Straits of Florida. While there are a number of different analyses that can be done using these data, recently, we reached out to the Marine Program Leader and Lead Meteorologist Chris Rothwell at the Key West branch of the National Weather Service who, working with Ph.D. candidate Caitlin Dirkes at Florida State University, has produced preliminary results on the climatology of the offshore position of the Florida Current/Gulf Stream (in nautical miles) from eight key reef points in the Straits of Florida (From west to east: Dry Tortugas Light, Cosgrove Shoal Light, Sand Key Light, Looe Key Light, Sombrero Key Light versus Alligator Reef Light, Molasses Reef Light, and Carysfort Reef Light). In other words, they are responsible for producing the following text and graphical report on the approximate shoreward edge of the Gulf Stream. One of their preliminary findings is that the north wall of the Gulf Stream is generally closer to the shore/reef in winters and summers, with greater variability for western sites within the Straits of Florida. Based on these observations and preliminary results, our program intends to compare dolphinfish release sites and movements within the Keys relative to the seasonal and interannual variability in Gulf Stream position along this reef tract. The question is do dolphin move faster if tagged and released well within the main flow of the Gulf Stream. Over the years we have documented an overall northern movement trend for dolphinfish along the U.S. East Coast. Many recaptures over the past few years, however, have led us to focus on the variability in movement speeds for dolphin along the Lower Florida Keys. Last year, a number of lingering movements were observed and recently John Anderson of Lexington, South Carolina, added another to the list. He recaptured a Killin’ Time II tagged dolphin 6 days after and west of its release site. Yet another recent slow movement is the fish recaptured by Camron Jaques, 5 days after it was released by Killin’ Time II, while fishing out of Hawks Cay off Duck Key. Connecting the release and recapture sites puts this straightline movement rate at just over 10 miles per day. Yet, two days after Camron reported this fish, Alejandro Batista, while fishing off Islamorada recaptured a different Killin’ Time II tagged fish less than a day after it was a released off Cudjoe Key. Does this variability relate at all to the variability in position of the northern edge of the Gulf Stream current in the Straits of Florida with relation to where these fish were caught, tagged, and released? Stay tuned for future updates as we delve further into this analysis. A special thanks to all the anglers who reported recoveries of tagged dolphin in Florida this June.

For the first time ever, Captain Don Gates and the Killin’ Time II Fishing Team recovered a tagged fish! One would think that after they have tagged and released 3,357 fish this event would have happened sooner. Nonetheless, the recovery occurred 5 days after they tagged the fish approximately 10.74 miles south of where they released it. This represents a 2.14 mile per day movement rate and represents one of many lingering movements of dolphin observed in June off the Lower and Middle Keys. In the figure below, the majority of Killin’ Time II’s June recoveries in the Keys represented movements that were very slow. While the amount of fishing pressure can lead to fish being recaptured sooner which can be misleading if dispersal distances are low, the fact that a number of fish were recaptured 3-5 days after being released in the same general area is an interesting pattern to note. Even when you consider their recaptures to the Upper Keys and central Florida (figure below) you can see that many of the dolphin moving through the area were not racing through the Straits as we saw last June. Click here to see last June’s movement analysis. What needs to be done is an in-depth analysis of all eastern Florida shelf movements based on the trajectory of the Florida Current and the strength and position of the Gulf Stream. Additional correlates can include, but are not limited to, the movement of sargassum through the Straits, SSTs, chlorophyll a, etc. With more than 300 Florida in-state recoveries generated from anglers participating in the DRP since 2002, the amount of information gleaned from an in-depth analysis of this information can lead to better understanding seasonal trends in dolphin abundance, movements, and life history traits in the Florida Straits system. Help us fund this analysis by supporting the Dolphinfish Research Program. Donate what you can today so we can allocate resources to undertake this important analysis.


